Figure 1. Mid-year Population Estimates

Note: In millions.
Source: Own design. Based on Mitchell, 1998.
Table 1. Greek and Portuguese Population
|
Greece |
Portugal |
|||
|
Year |
Male |
Female |
Male |
Female |
|
1940 |
49,8% |
50,2% |
48,1% |
51,9% |
|
1950 |
48,8% |
51,2% |
48,6% |
51,4% |
|
1960 |
48,8% |
51,2% |
47,9% |
52,1% |
|
1970 |
48,9% |
51,1% |
47,4% |
52,6% |
Source: Own design. Based on Mitchell, 1998.
Figure 2. Real GDP per capita (Real GDP per capita in 2011$) for Greece and Portugal.

Source: Own design. Based on Maddison Project Database, 2020.
Figure 3. Cost-of-living/Consumer Prices Indices
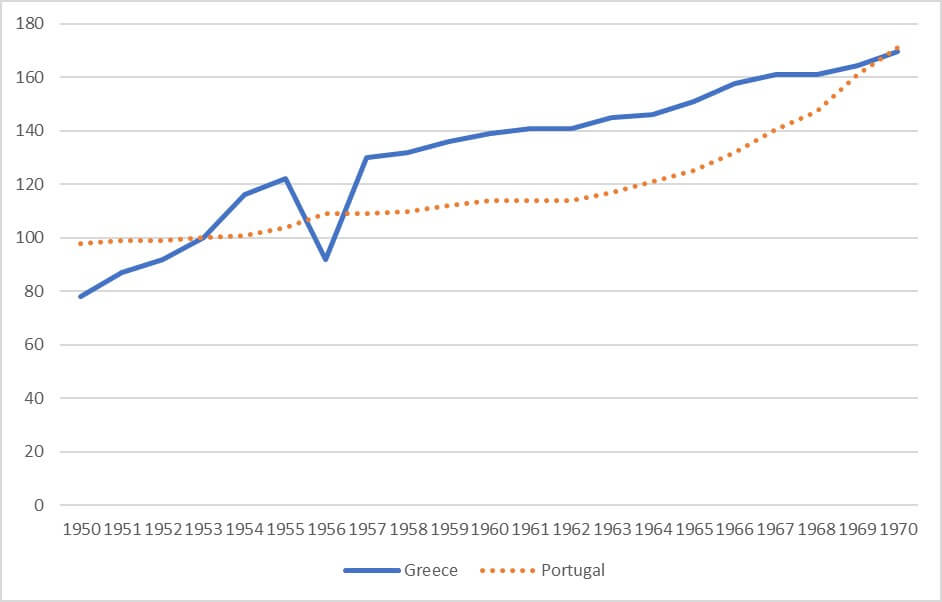
Note. (1953=100).
Source: Own design. Based on Mitchell, 1998.
Figure 4. Number of Students in Universities

Note: in thousands.
Source: Own design. Based on Mitchell, 1998
Figure 5 Emigrants from Greece and Portugal
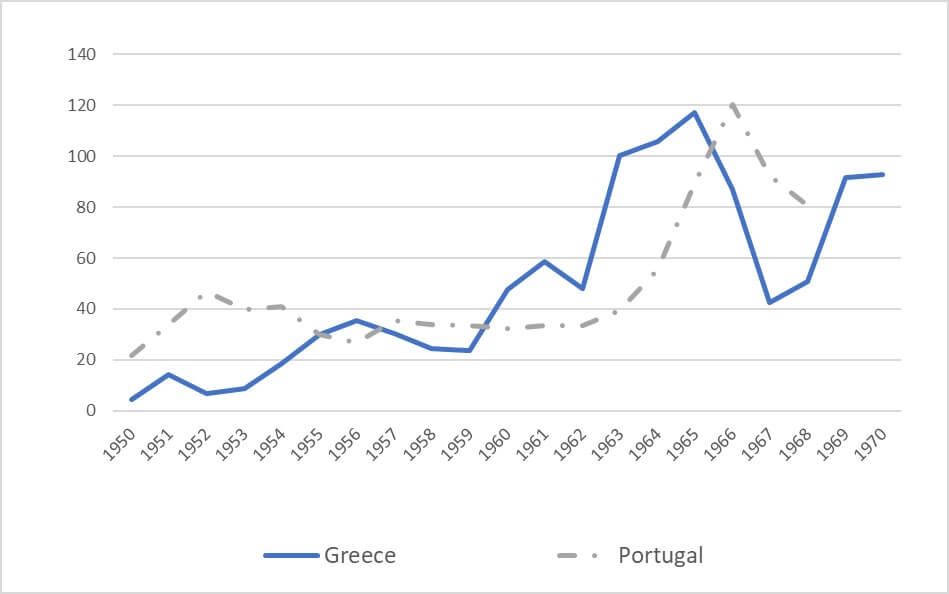
Note: in thousands.
Source: Own design. Based on Mitchell, 1998.
Figure 6. Greece and Portugal, Annual Change of Emigration
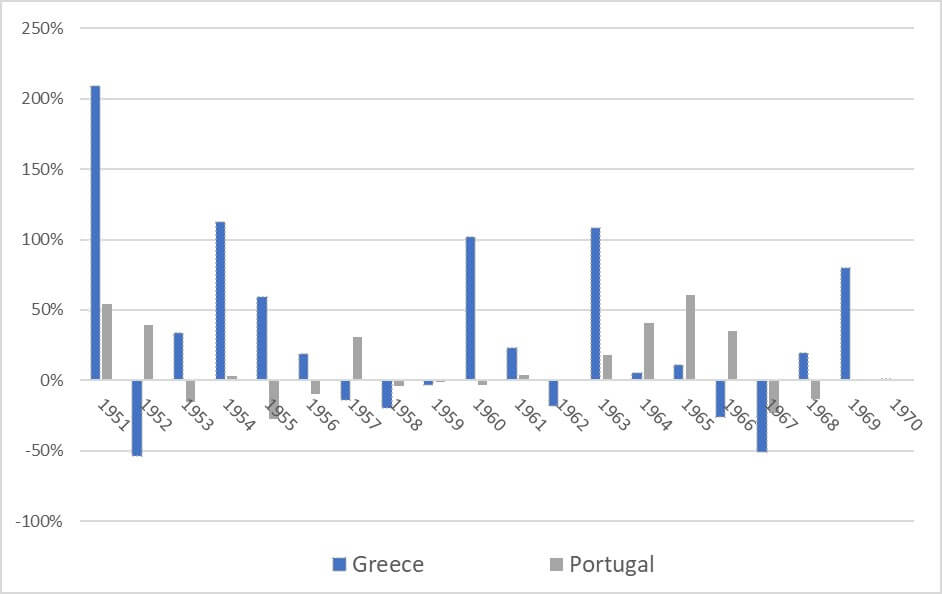
Source: Own design. Based on Mitchell, 1998.
Figure 7. Inflows of Remittance (US millions)

Source: Own design. Based on Swamy, 1981.
Figure 8. Per capita remittance inflows (US thousands) for European South
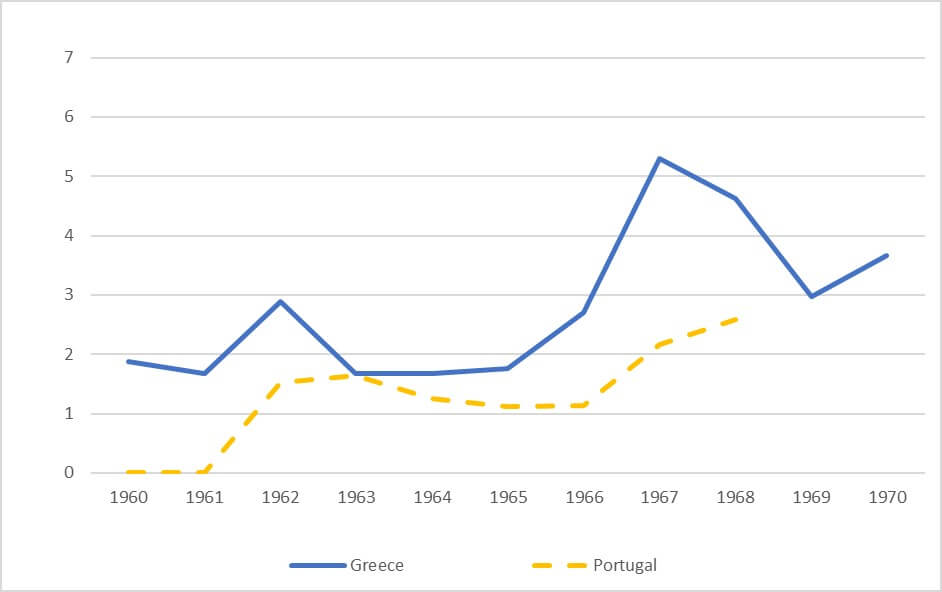
Source: Own design. Based on Swamy, 1981.
Table 2 Annual percentage proportion per capita remittance inflows per capita GDP
|
Year |
Greece |
Portugal |
|
||
|
1960 |
38% |
|
|||
|
1961 |
31% |
|
|||
|
1962 |
52% |
29% |
|
||
|
1963 |
27% |
29% |
|
||
|
1964 |
25% |
21% |
|
||
|
1965 |
25% |
17% |
|
||
|
1966 |
36% |
17% |
|
||
|
1967 |
67% |
30% |
|
||
|
1968 |
55% |
33% |
|
||
|
1969 |
32% |
|
|||
|
1970 |
37% |
56% |
|
||
Source: Own design. Based on Swamy, 1981.
Figure 9 Greek GDP per capita and emigration
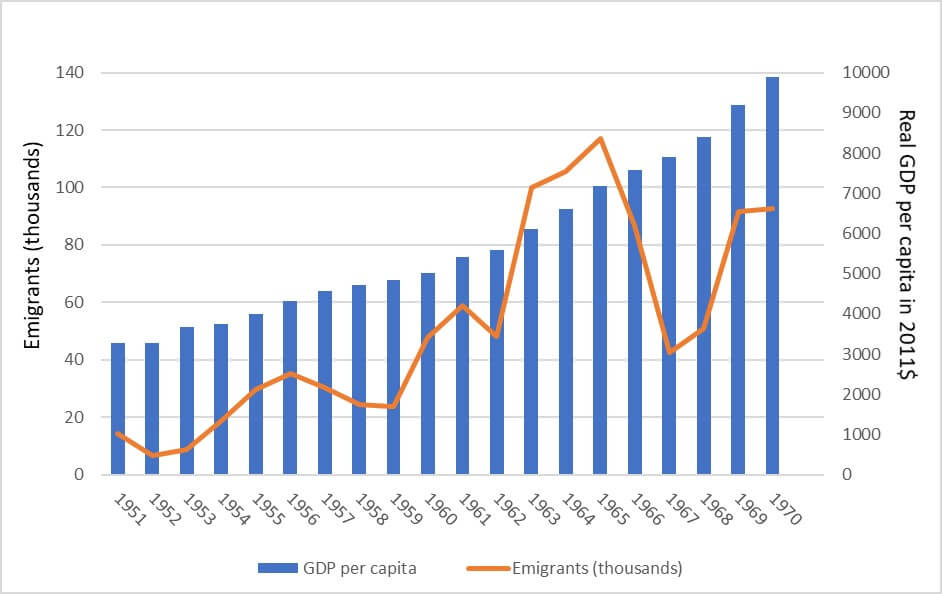
Source: Own design. Based on Maddison Project Database, 2020 and Mitchell, 1998.
Figure 10. The relationship between Greek GDP per capita and emigration

Source: Own design. Based on Maddison Project Database, 2020 and Mitchell, 1998
Figure 11. Greek Emigration and Remittances Inflows in Greece

Source: Own design. Based on Swamy, 1981, Nikolitsas 1959, Emke-Poulopoulou 1986, and Mitchell, 1998
Figure 12. Relationship between Greek Emigration and Remittances Inflows in Greece

Source: Own design. Based on Swamy, 1981, Nikolitsas 1959, Emke-Poulopoulou 1986, and Mitchell, 1998
Figure 13 Greek GDP per Capita and Inflows of Workers Remittances

Source: Own design. Based on Swamy, 1981, Nikolitsas 1959, Emke-Poulopoulou 1986, and Mitchell, 1998.
Figure 14 Relationship between Real GDP per Capita and Remittances Inflows in Greece

Source: Own design. Based on Swamy, 1981, Nikolitsas 1959, Emke-Poulopoulou 1986, and Mitchell, 1998.
Figure 15 GDP of Portugal per capita (in 2011$) and emigration
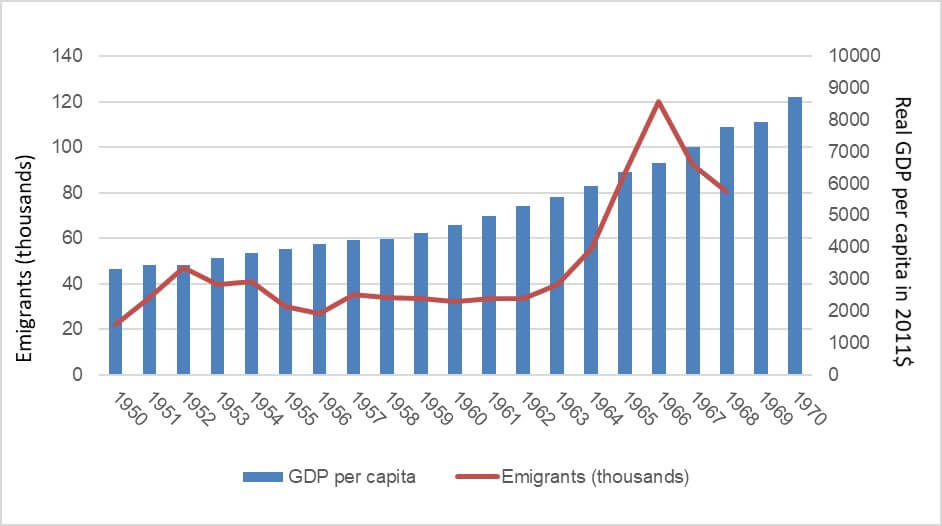
Source: Own design. Based on Maddison Project Database, 2020 and Mitchell, 1998.
Figure 16 Relationship between Real GDP of Portugal per capita (in 2011$) and emigration

Source: Own design. Based on Maddison Project Database, 2020 and Mitchell, 1998.
Figure 17. Portuguese Emigrants and Remittances Inflows in Portugal

Source: Own design. Based on Maddison Project Database, and Swamy, 1981.
Figure 18. Relationship between Portuguese Emigration and Remittances Inflows in Portugal

Source: Own design. Based on Maddison Project Database, and Swamy, 1981.
Figure 19. Portuguese Real GDP per Capita and Inflows of Workers Remittances
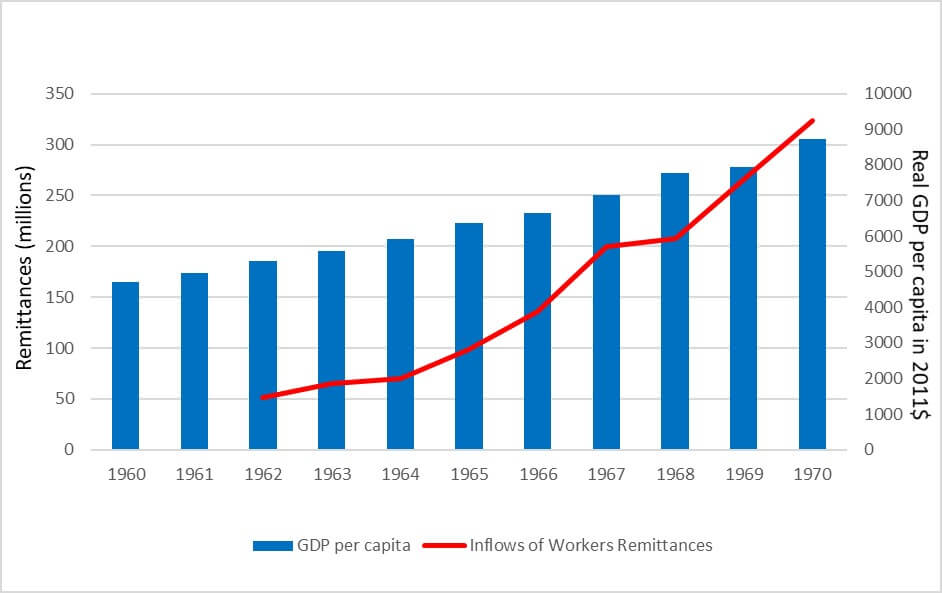
Source: Own design. Based on Maddison Project Database, and Swamy, 1981.
Figure 20. Relationship between Portuguese Real GDP per Capita and Inflows of Workers Remittances
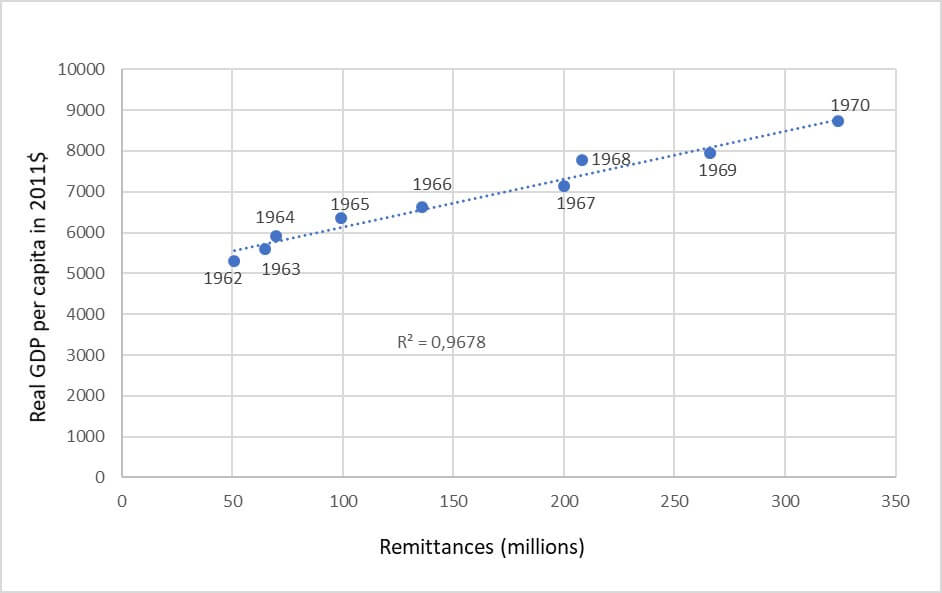
Source: Own design. Based on Maddison Project Database, and Swamy, 1981.
Figure 21 Italian Emigration to South America

Note: in thousands.
Source: Authors’ own based on data from ICEM Handbook 1962, p. 42 & ILO, International Migration, Geneva, 1959, p. 182, Istituto centrale di statistica, 1986, p. 59.
Figure 22 Spanish Emigration to South America

Note: in thousands.
Source: Authors’ own based on data from ICEM Handbook 1962, p. 43, ILO, International Migration, Geneva, 1959, p. 184, Instituto Nacional de Estadística.
Figure 23 Greek Emigration to South America
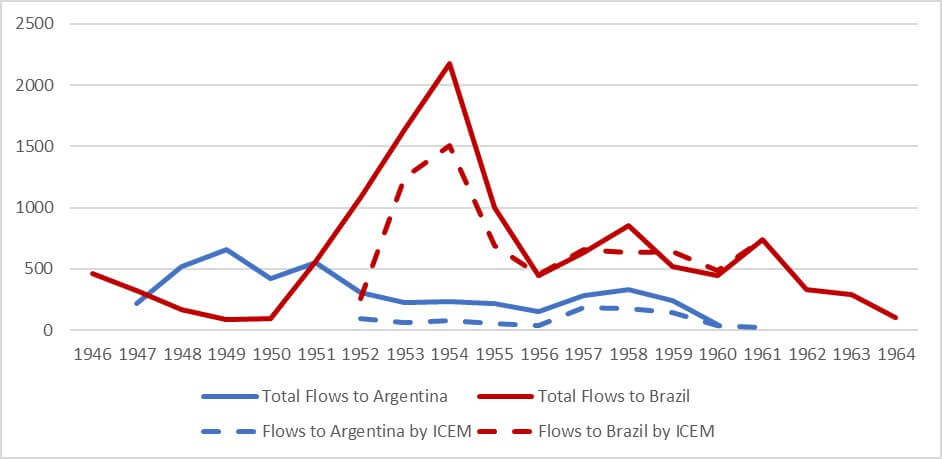
Note: For Argentina in 1960 are considered only permanent immigrants.
Sources: Authors’ own based on data from ICEM Handbook 1962, p.42; Damilakou and Papadopoulos in this volume.
Figure 24 Portuguese Emigration to South America
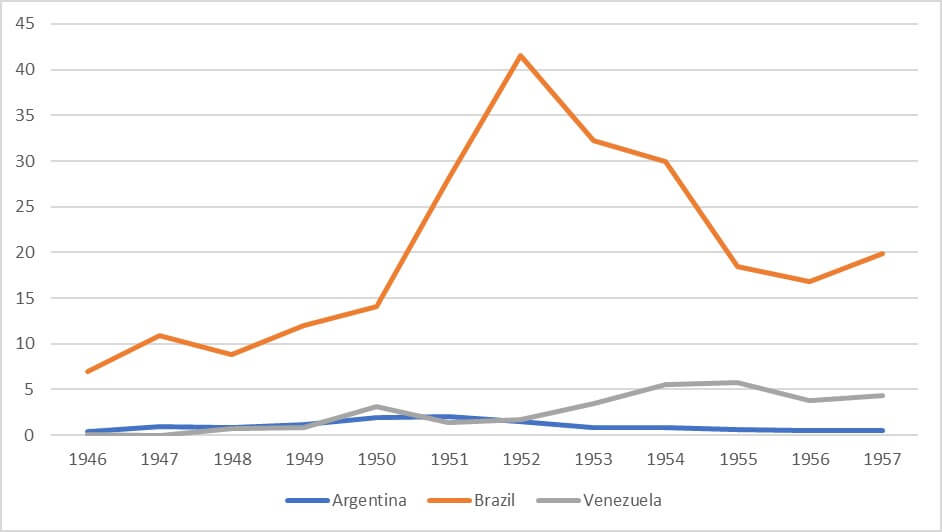
Note: In thousands
Sources: Authors’ own based on data from ILO, International Migration, Geneva, 1959, p. 186
Figure 25 Argentina: Immigration from European South
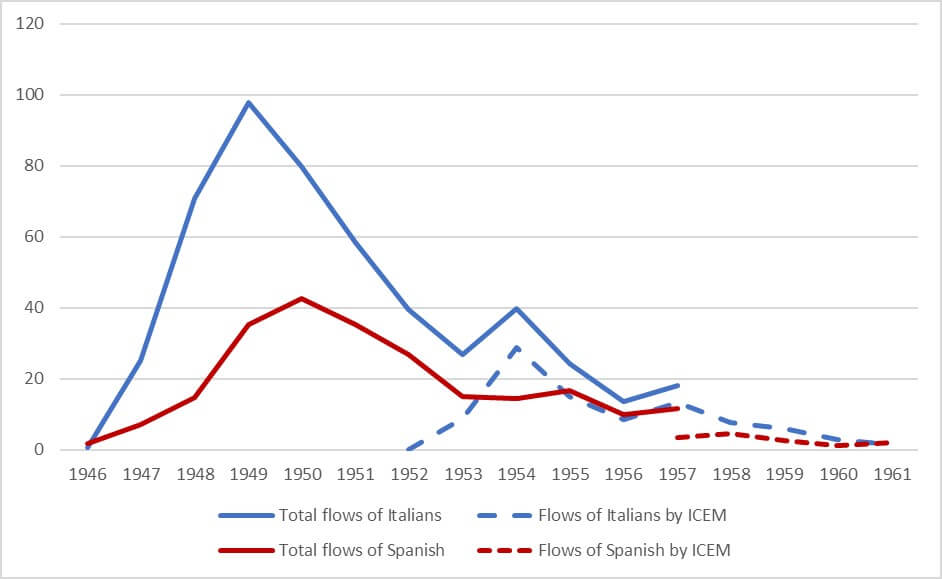
Notes: In thousands. The figures refer to alien second- and third-class passengers travelling by sea.
Sources: Authors’ own based on data from ILO, International Migration, Geneva, 1959, p. 193; ICEM Handbook 1962, p.45.
Figure 26 Brazil: Immigration from European South
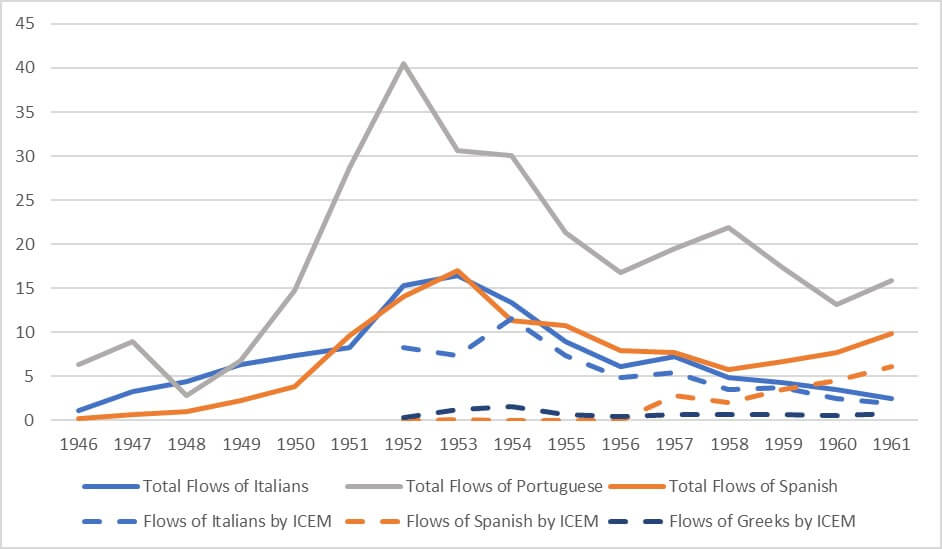
Notes: In thousands
Sources: Authors’ own based on data from Levy, 1974 and ICEM Handbook 1962, p.45
Figure 27 Relationship between GDP per capita and emigration
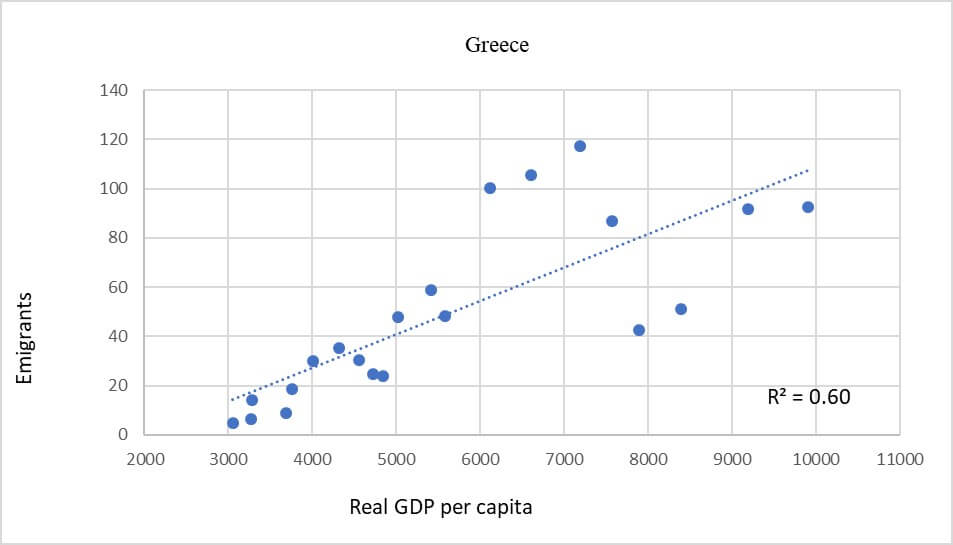

Notes: GDP per capita in 2011$, emigrants in thousands.
Source: Own design. Based on Maddison Project Database, 2020 and Mitchell, 1998 and Fernández Vicente in the present volume
Figure 28 Argentina: GDP per capita and immigration

Notes: Emigrants in thousands, real GDP per capita in 2011$.
Source: Own design. Based on Maddison Project Database, 2020 and Mitchell, 1998.
Figure 29 Brazil: GDP per capita and immigration
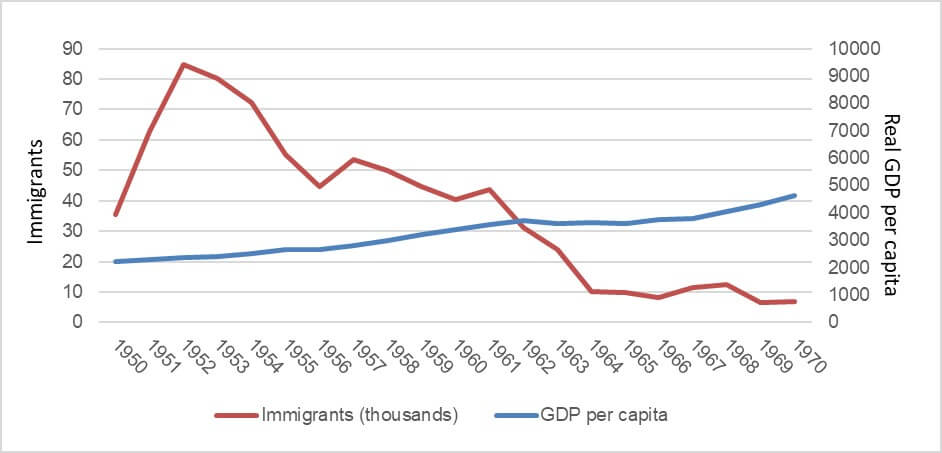
Notes: Emigrants in thousands, real GDP per capita in 2011$.
Source: Own design. Based on Maddison Project Database, 2020 and Levy, 1974.
Figure 30 Greece: Unemployment and Emigration
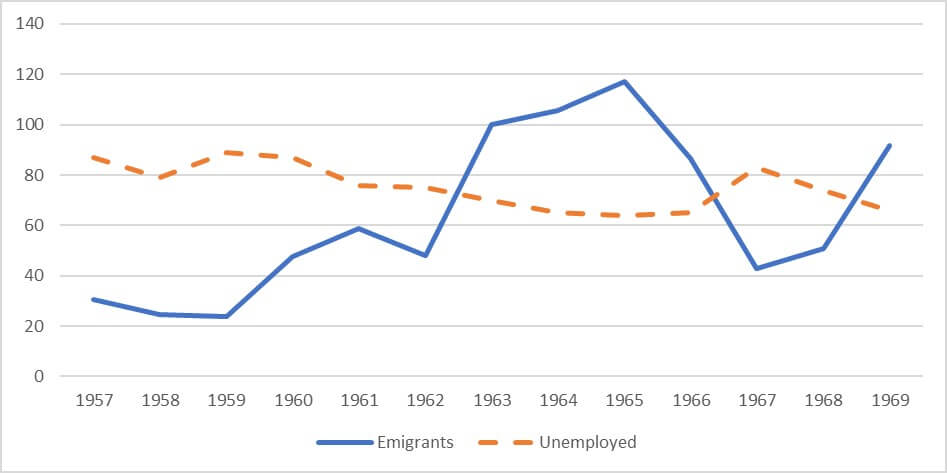
Notes: emigrants in thousands, unemployment in thousands.
Sources: Authors’ own based on data from Mitchell, 1998.
References
Emke-Poulopoulou H., (1986), Προβλήματα μετανάστευσης-παλιννόστησης, Athens, IMEO-EDIM.
Instituto Nacional de Estadística, España.
International Labour Office, (1959), International Migration 1945-1957, Geneva, ILO.
International Monetary Fund, and International Monetary Fund. 1996. Balance of payments textbook. Washington, DC: International Monetary Fund.http://search.ebscohost.com/login.aspx?direct=true&scope=site&db=nlebk&db=nlabk&AN=449705.
Istituto centrale di statistica (1986). Sommario di statistiche storiche, 1926-1985. Roma: Istituto centrale di statistica.
Labour Review. Vol. 99, no. 6 (June 1969) Geneva: International Labour Office.
Maddison Project Database, version 2020. Available at: https://www.rug.nl/ggdc/historicaldevelopment/maddison/releases/maddison-project-database-2020?lang=en
Mitchel, B.R. (1975). European Historical Statistics, 1750-1970, The Macmillan Press, p.p. 138-140.
Mitchel, B. R. (1993). International Historical Statistics: The Americas 1750–1988, New York: Stockton Press.
Mitchel, B. R. (1998). International Historical Statistics: European Historical Statistics, 1750-1993, The Macmillan Press.
Swamy, G. (1981). International migrant workers' remittances issues and prospects, World Bank, Staff working paper; no. SWP 481.


